4 Important things to keep in mind when planning for retirement
Do you have all the bases covered to pave the way for a happy and secure retirement, or does your...
In this week's post we'll discuss the importance of having products within your mix of your portfolio that you can count on when the market drops.
A bit of backstory - last week I met up and had lunch with Patrick Kelly, best-selling author and the man who wrote the Stress-Free Retirement book - a book that we often lend out to people who come in for a consultation and want to read more on how to help eliminate the common pain-points and hassles on the path to retirement.
We were discussing his new book, but started to go back to a few topics that he discusses in Stress-Free Retirement, and one of those is just how powerful never taking a loss is in building long-term wealth.
Take a moment to consider this hypothetical scenario:
There are two black-jack tables in front of you, and you are trying to choose which one you'd rather be playing:
Table 1 - a traditional blackjack table. You bet $10, and if your hand beats the dealer, you win your $10 back and an additional $10. If the dealer's hand is better than your hand, you lose your $10 bet.
Table 2 - The Power of Zero table. You bet $10, and if your hand beats the dealer, you win your $10 back, but only an additional $5. However, if the dealer's hand is better than your hand, you simply keep your $10 bet and you lose nothing.
Which table would you sit down at?This scenario helps us become more familiar with Patrick Kelly's synopsis in chapter 7 of Stress-Free Retirement. In his book, we take a look at an extreme (but real) example of the history of the Japanese Nikkei 225 index - one of the WORST performing major stock indexes from 1989 to 20111.
Why use this index as an example? If we can show that the Power of Zero works with THIS scenario, think of what it could do in markets that haven't been as extreme.
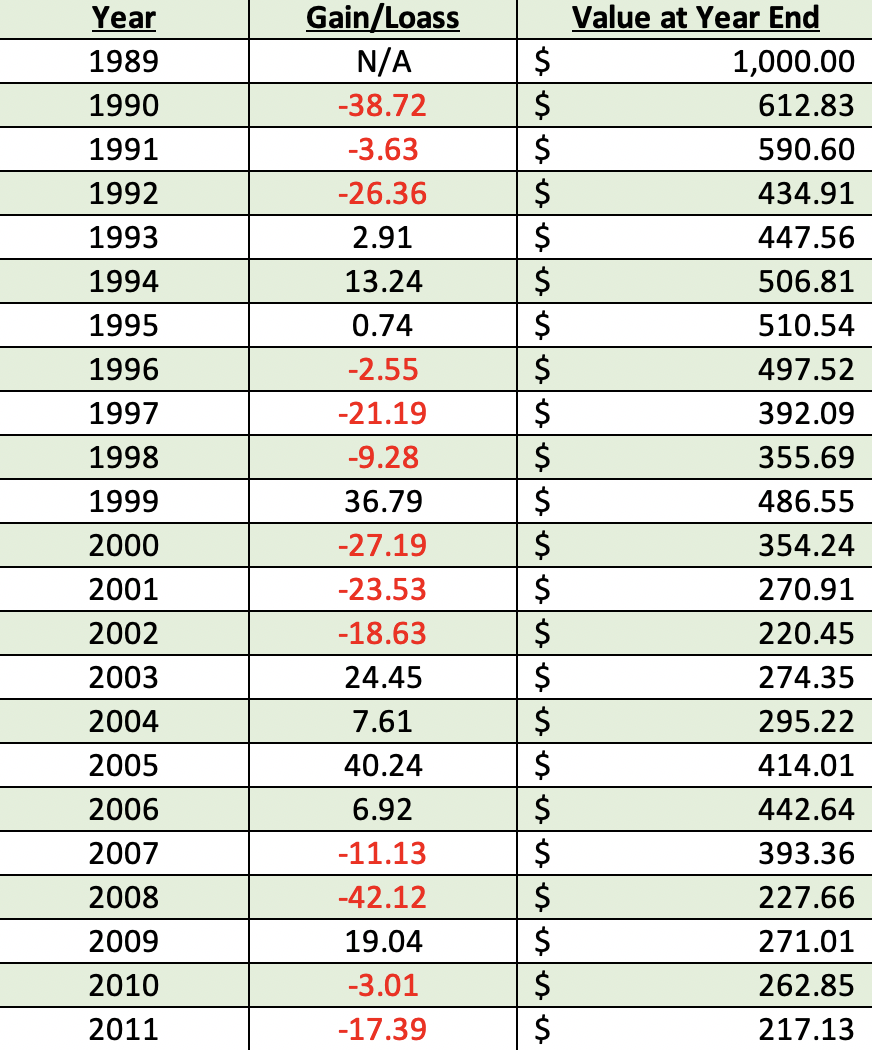
::Nikkei 225 Index's Performance from 12/31/1989 to 12/31/2011:: 1
Looking at Nikkei's index performance, there were some years that showed AMAZING gains (1999, 2003, 2005), but the losses during this period have more than wiped out those positive returns, leaving a person who may have hypothetically invested $1,000 in 1989 to have only $217.13 in 2011. (That's a 79% NEGATIVE return!)
Now, let's use this same chart, but make a hypothetical change - we exchange the negative returns with zero (no gains or losses for that year). How does that affect our chart?
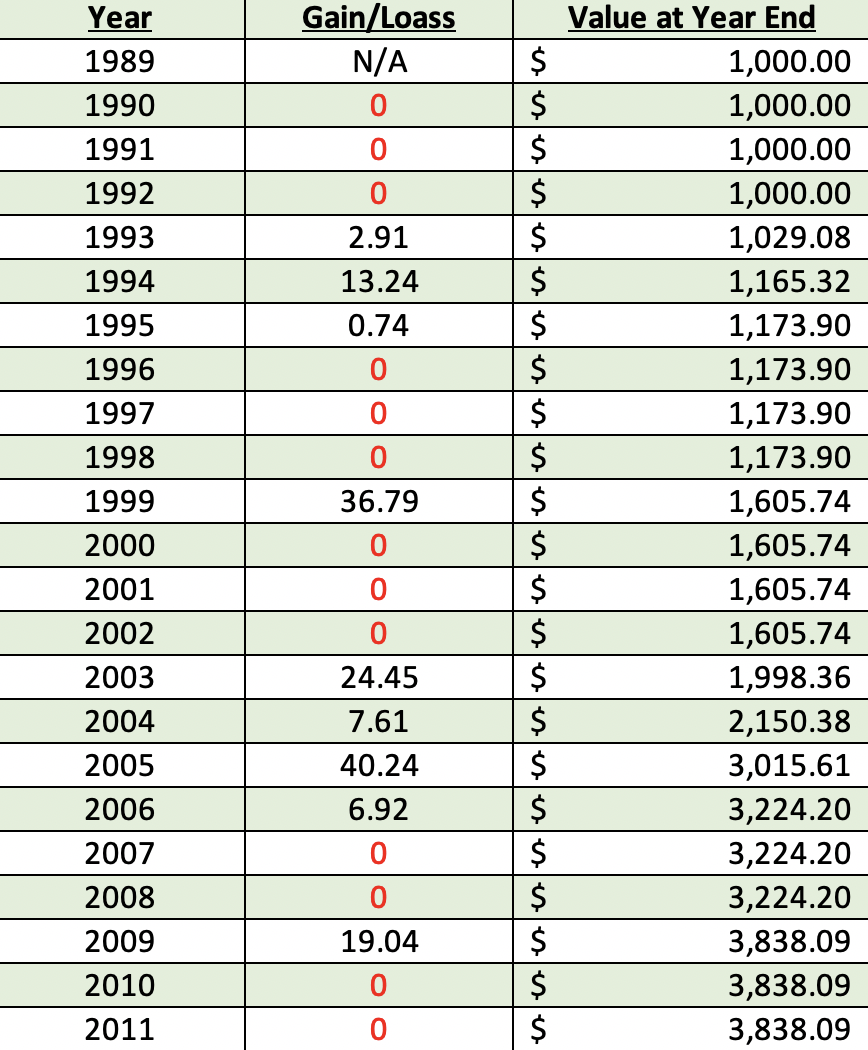
::Hypothetical Example of Nikkei 225 Index Removing Loss Years & Replacing With Zeros::
Now we're talking! Just by removing years of loss, the performance went from losing 79% to a positive return of 284%!
Taking things a step FURTHER, let's continue to use those zeros in the years that were negative in the initial chart, AND let's cap any positive years to a maximum of 7%:
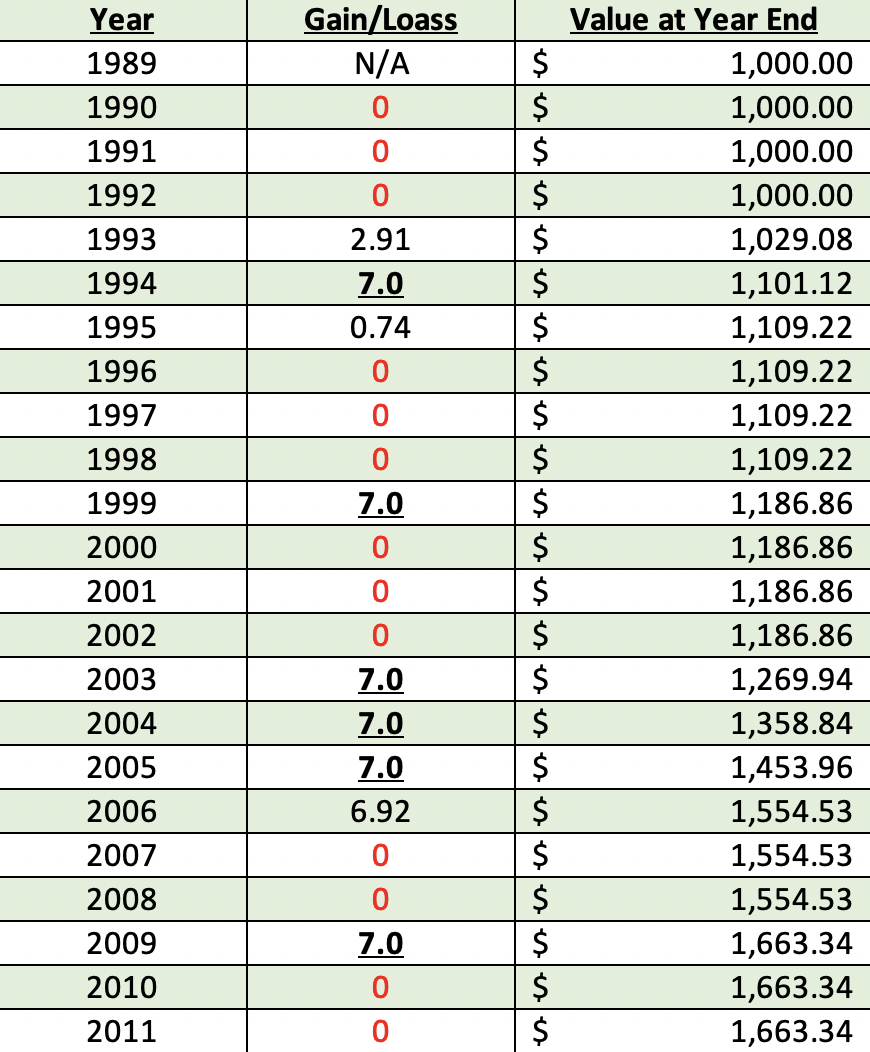
::Hypothetical Example of Nikkei 225 Index with using Zeros in the loss years, and a 7% MAX cap on Annual Gains::
Still remarkable, eh?
The last hypothetical example considerably limits the gains from the higher years (36% in 1999, 24% in 2003, 40% in 2005), but still shows a higher average return than the index itself did during that same time frame.
What does this show? Helping to protect yourself from a significant market downturn of can add more significance than achieving huge returns.
Now, it should be made clear that NO ONE knows what the market will be like in the next 10 or 20 years. But regardless of what the market does, I believe that protecting your downside is clutch to obtaining long-term success.
Have questions or still confused by the concept of the power of zero? Request time to speak with our office by clicking here to book time directly on our calendar and we'll take the time to go over this in depth. Our 365 Retirement Planning process is designed to create a personal relationship with our clients, taking the time to truly understand their unique personal and financial situation. Just as no two people are alike, we believe no two retirement plans should be, either.
1: Source - https://www.macrotrends.net/2593/nikkei-225-index-historical-chart-data
These hypothetical examples do not reflect actual performance. These hypothetical examples are not intended to be indicative of any specific product, results are for illustrative performance only and are not intended to represent past or future performance. This does not take in to account possible fees, riders, or other charges.